Hotel Occupancy Rate Decreases by 1.1% Year-Over-Year
According to the latest data from CoStar, U.S. hotel performance has shown an increase compared to the previous week. However, the occupancy rate has experienced a decrease of 1.1% year-over-year.
From December 3rd to 9th, 2023, the occupancy rate was recorded at 58.7%, down 1.1% from the same week in the previous year. The average daily rate (ADR) increased by 4.5% to US$153.36, while the revenue per available room (RevPAR) saw a growth of 3.3% to US$89.98.
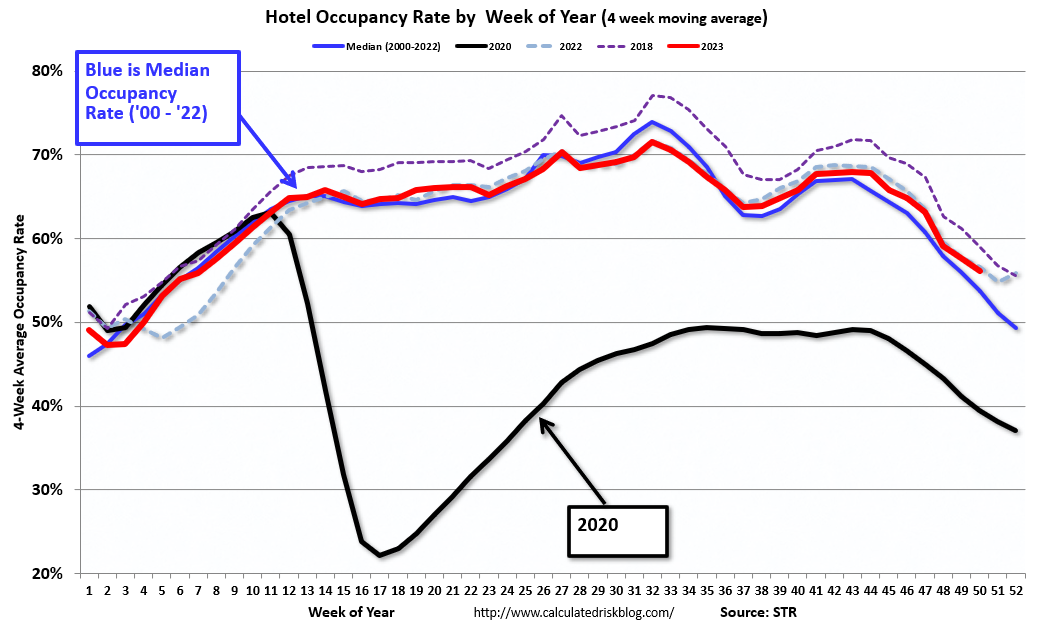
The graph below illustrates the seasonal pattern of the hotel occupancy rate, using the four-week average. The red line represents 2023, the black line denotes 2020, and the blue line represents the median. The dashed light blue line corresponds to 2022, and the dashed purple line represents the record year for hotel occupancy, which was 2018.
The 4-week average of the occupancy rate is currently tracking closely to last year’s rate and remains above the median rate from 2000 to 2022 (blue line on the graph). It is important to note that the y-axis of the graph does not start at zero to better illustrate the seasonal changes.
It is expected that the 4-week average of the occupancy rate will continue to decline seasonally until early 2024.
Source: Hotels: Occupancy Rate Decreased 1.1% Year-over-year