Fed’s Flow of Funds: Household Net Worth Increased $5.5 Trillion in Q2
The net worth of households and nonprofits rose to $154.3 trillion during the second quarter of 2023. The value of directly and indirectly held corporate equities increased $2.6 trillion and the value of real estate increased $2.5 trillion.
Household debt increased 2.7 percent at an annual rate in the second quarter of 2023. Consumer credit grew at an annual rate of 2.3 percent, while mortgage debt (excluding charge-offs) grew at an annual rate of 2.8 percent.
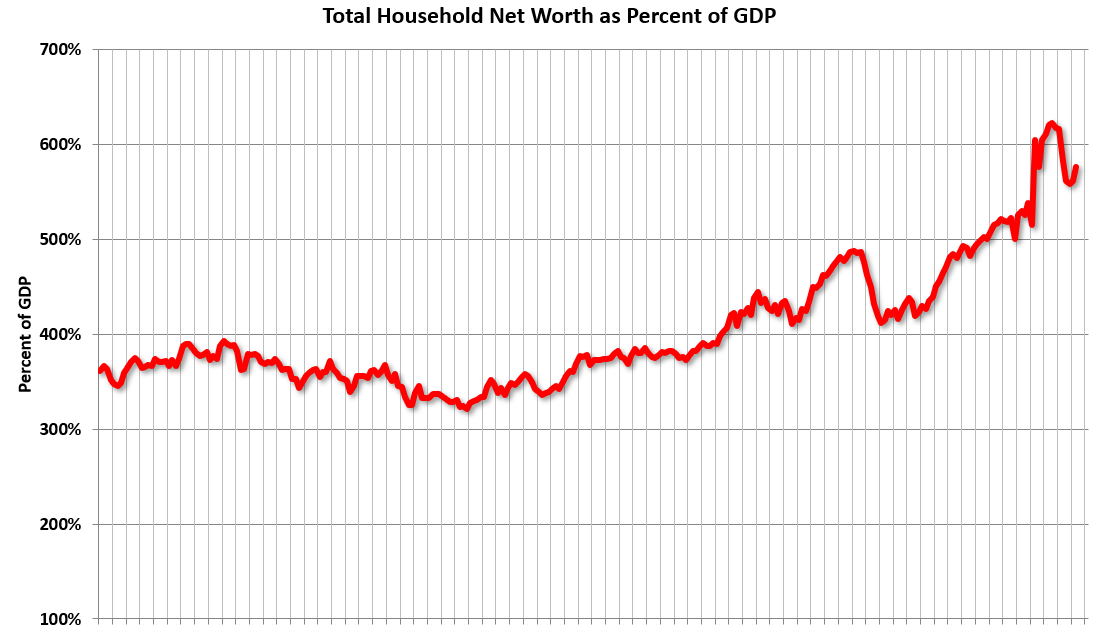
The first graph shows Households and Nonprofit net worth as a percent of GDP. Net worth increased $5.5 trillion in Q2 and is at an all-time high. As a percent of GDP, net worth increased in Q2, but is below the peak in 2021. This includes real estate and financial assets (stocks, bonds, pension reserves, deposits, etc) net of liabilities (mostly mortgages). Note that this does NOT include public debt obligations.
The second graph shows homeowner percent equity since 1952. Household percent equity (as measured by the Fed) collapsed when house prices fell sharply in 2007 and 2008. In Q2 2023, household percent equity (of household real estate) was at 71.1% – up from 70.0% in Q1, 2023. This is close to the highest percent equity since the 1960s. Note: This includes households with no mortgage debt.
The third graph shows household real estate assets and mortgage debt as a percent of GDP. Note this graph was impacted by the sharp decline in Q2 2020 GDP. Mortgage debt increased by $90 billion in Q2. Mortgage debt is up $2.15 trillion from the peak during the housing bubble, but, as a percent of GDP is at 47.9% – down from Q1 – and down from a peak of 73.3% of GDP during the housing bust. The value of real estate, as a percent of GDP, increased in Q2 – but is below the peak in Q2 2022 – and is well above the average of the last 30 years.
Source: Fed’s Flow of Funds: Household Net Worth Increased $5.5 Trillion in Q2