Existing-Home Sales Decreased to 3.96 million SAAR in September
Existing-home sales faded in September, according to the National Association of REALTORS®. Among the four major U.S. regions, sales rose in the Northeast but receded in the Midwest, South and West. All four regions registered year-over-year sales declines.
Total existing-home sales – completed transactions that include single-family homes, townhomes, condominiums and co-ops – waned 2.0% from August to a seasonally adjusted annual rate of 3.96 million in September. Year-over-year, sales dropped 15.4% (down from 4.68 million in September 2022).
Total housing inventory registered at the end of September was 1.13 million units, up 2.7% from August but down 8.1% from one year ago (1.23 million). Unsold inventory sits at a 3.4-month supply at the current sales pace, up from 3.3 months in August and 3.2 months in September 2022.
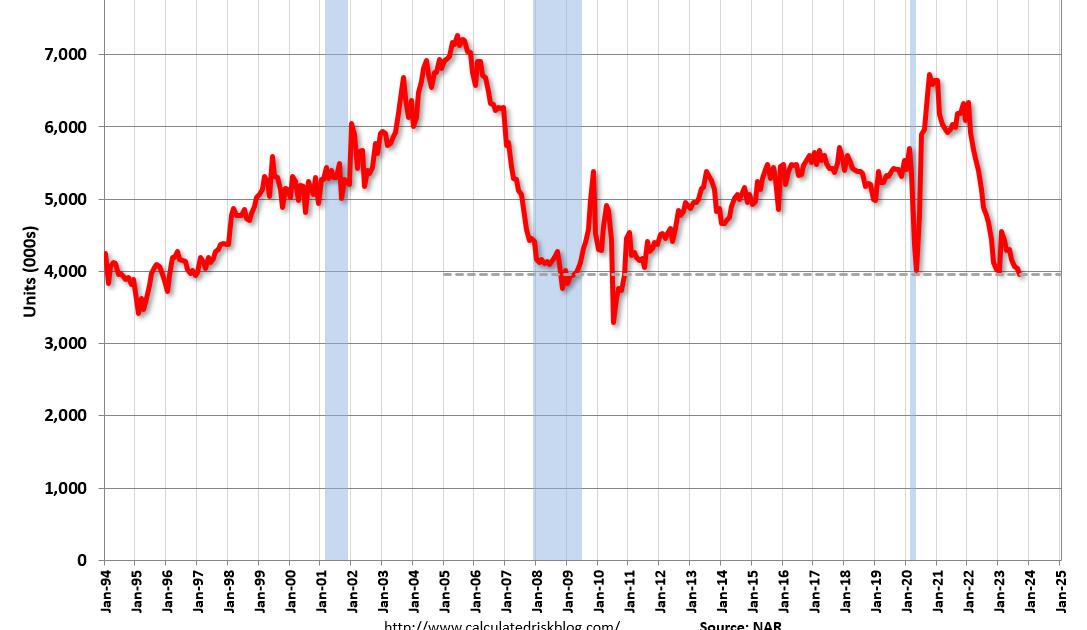
This graph shows existing home sales, on a Seasonally Adjusted Annual Rate (SAAR) basis since 1994.
Sales in September (3.96 million SAAR) were down 2.0% from the previous month and were 15.4% below the September 2022 sales rate.
The second graph shows nationwide inventory for existing homes.
According to the NAR, inventory increased to 1.13 million in September down from 1.10 million the previous month.
According to the NAR, inventory increased to 1.13 million in September down from 1.10 million the previous month.
Headline inventory is not seasonally adjusted, and inventory usually decreases to the seasonal lows in December and January, and peaks in mid-to-late summer.
The last graph shows the year-over-year (YoY) change in reported existing home inventory and months-of-supply. Since inventory is not seasonally adjusted, it really helps to look at the YoY change. Note: Months-of-supply is based on the seasonally adjusted sales and not seasonally adjusted inventory.
Inventory was down 8.1% year-over-year (blue) in September compared to September 2022.
Months of supply (red) increased to 3.4 months in September from 3.3 months the previous month.
This was slightly above the consensus forecast. I’ll have more later.
Source: NAR: Existing-Home Sales Decreased to 3.96 million SAAR in September